Situation
VMware began focusing on the User Experience of its employees (colleagues) as a critical driver of its business success. The focus impacted nearly everything from employee badges to transforming our entire product offering to a SaaS and Subscription model.
While we had Corporate-wide OKRs that explicitly noted “delightful and friction-free” experiences, our product and delivery teams struggled to discern actionable measures that would deliver on the promise of that objective.
Task
After talking with multiple teams who reached out for research support, I identified the need for a standard scorecard across VMware to measure Colleague Experience. A standard scorecard would help us determine where limited resources could be best utilized and how that investment could help us achieve our objectives with clear, accountable measures to replace our well-intentioned but perspective-based sentiment.
Action
To bring this vision to life, we followed a Design Thinking process. We began the work by aligning the team on the desired outcomes and the iterative approach we would take.
Our next step was to understand the problem better and frame the opportunity. We researched how other frameworks functioned and explored their limitations and advantages. We also interviewed our stakeholders to understand better their needs and how they would utilize this information.
After completing our research, we huddled together and synthesized the data together. We choose the more arduous path of synthesizing together because it forces conversations about what particular data points mean and how they correlate with other data points. The final benefit to the road less traveled is that the team arrives at a shared understanding of what we learned.
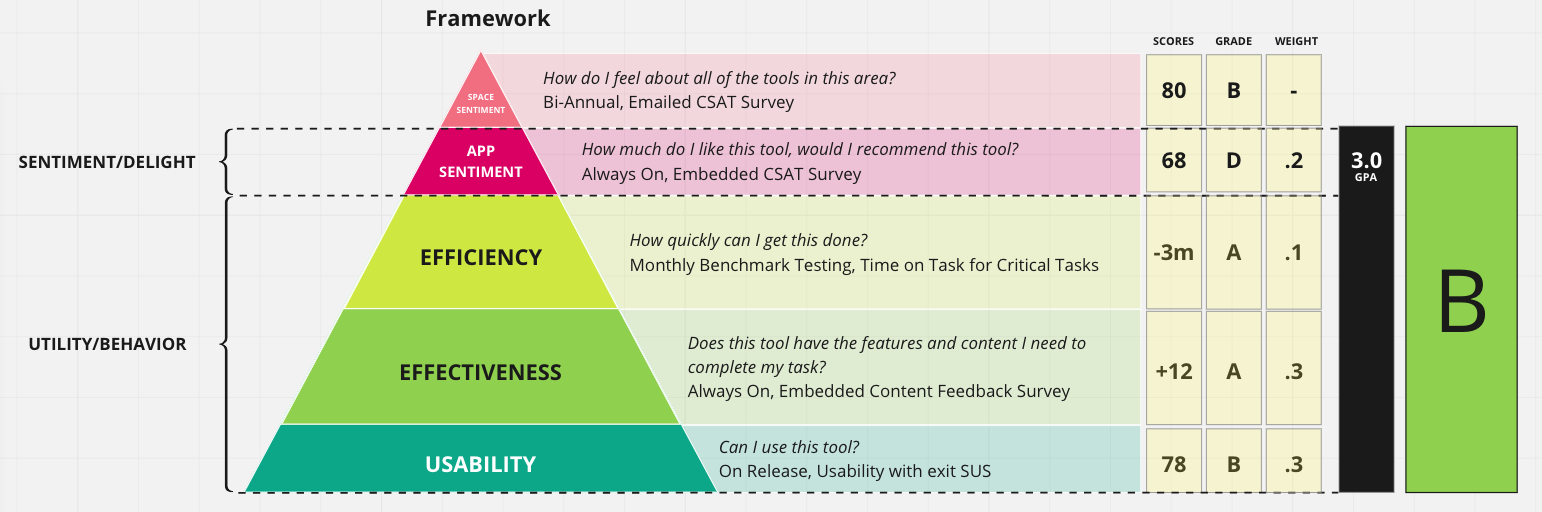
With a clear and shared understanding of our opportunity, we started ideating on a solution. We had some creative iterations and even a few wild explorations. Still, we settled on a more approachable framework that leveraged known mental models and delivered value to executive teams and hands-on keyboard product teams.
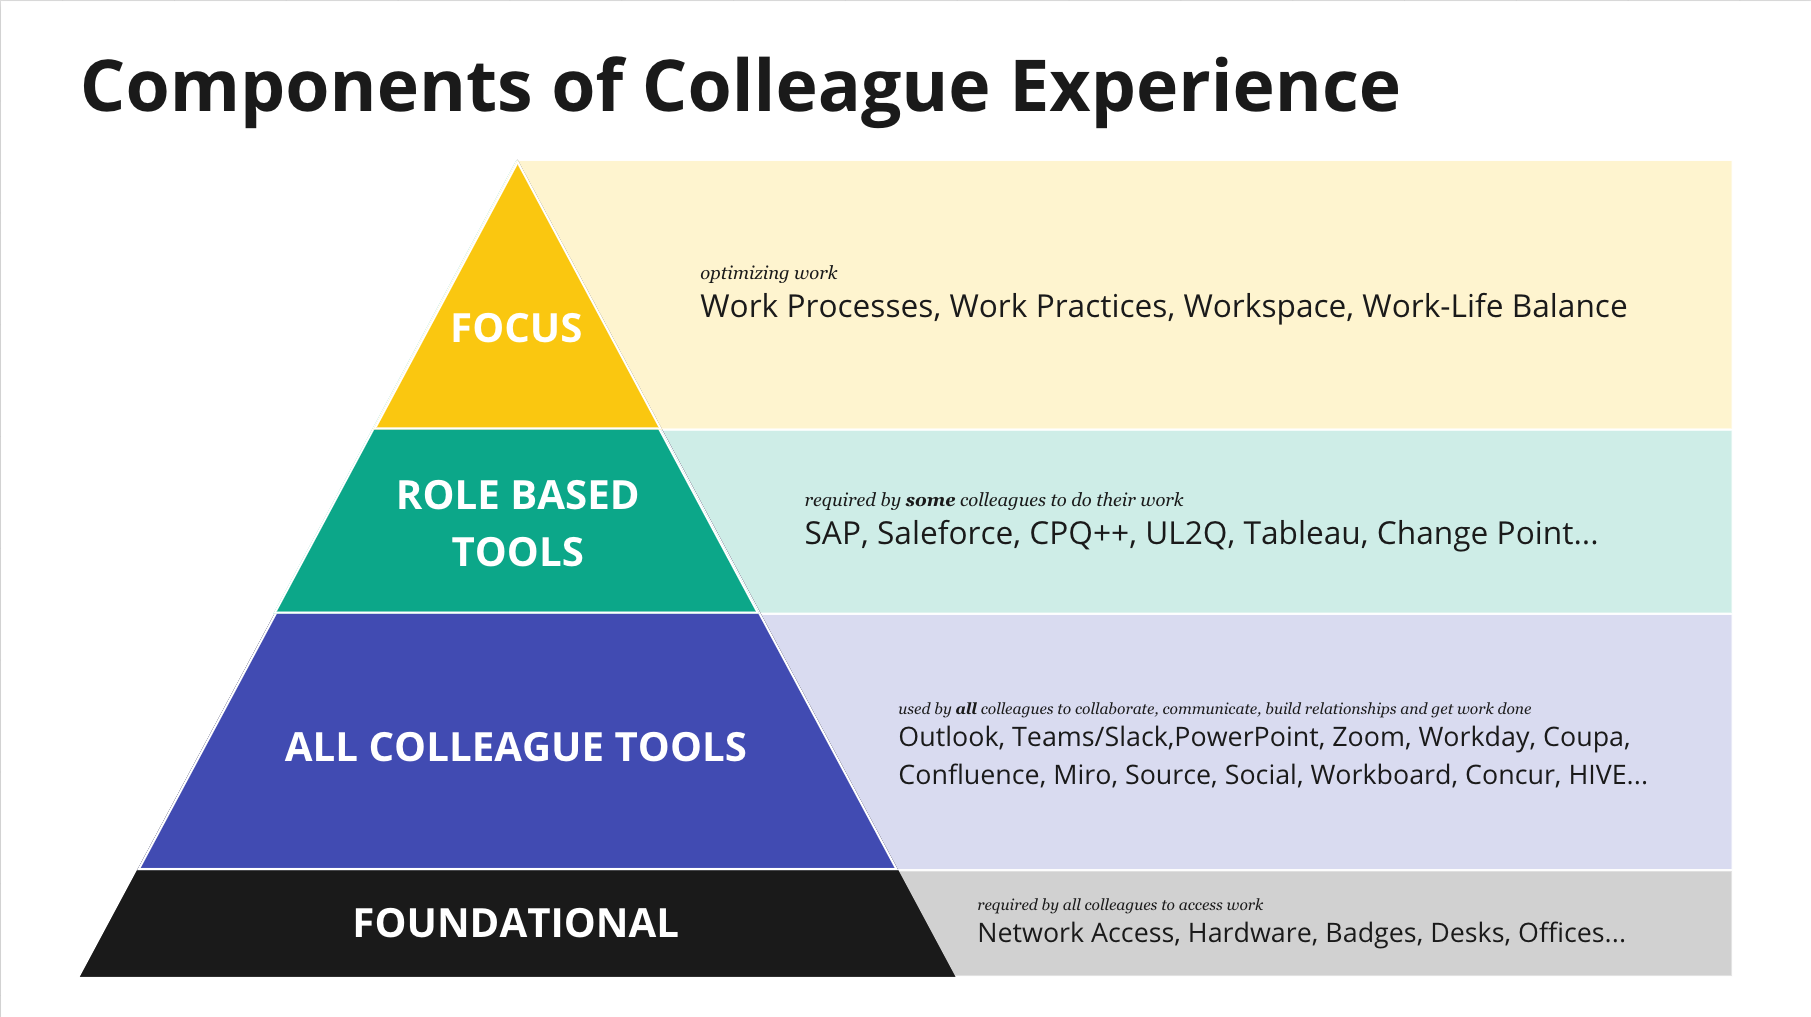
With the idea for our framework firmed up, we built a proof of concept around three tools representing different levels of complexity.
- Simple — Our corporate intranet has little app functionality but is a valuable centralized source of information critical to our colleagues.
- Complex — Our CPQ (Configure, Price, Quote) tool deals with thousands and thousands of skews across all VMware’s business units globally. It has a clearly defined set of user groups, but those groups have disparate needs.
- Oddball — Beyond measuring apps and sites, we also considered the measurement of colleagues’ experiences in our newly revised “Future of Work” offices.
We met with stakeholders from each team and built a pilot program to determine what to assess and which tools to use and launch the data capture efforts.
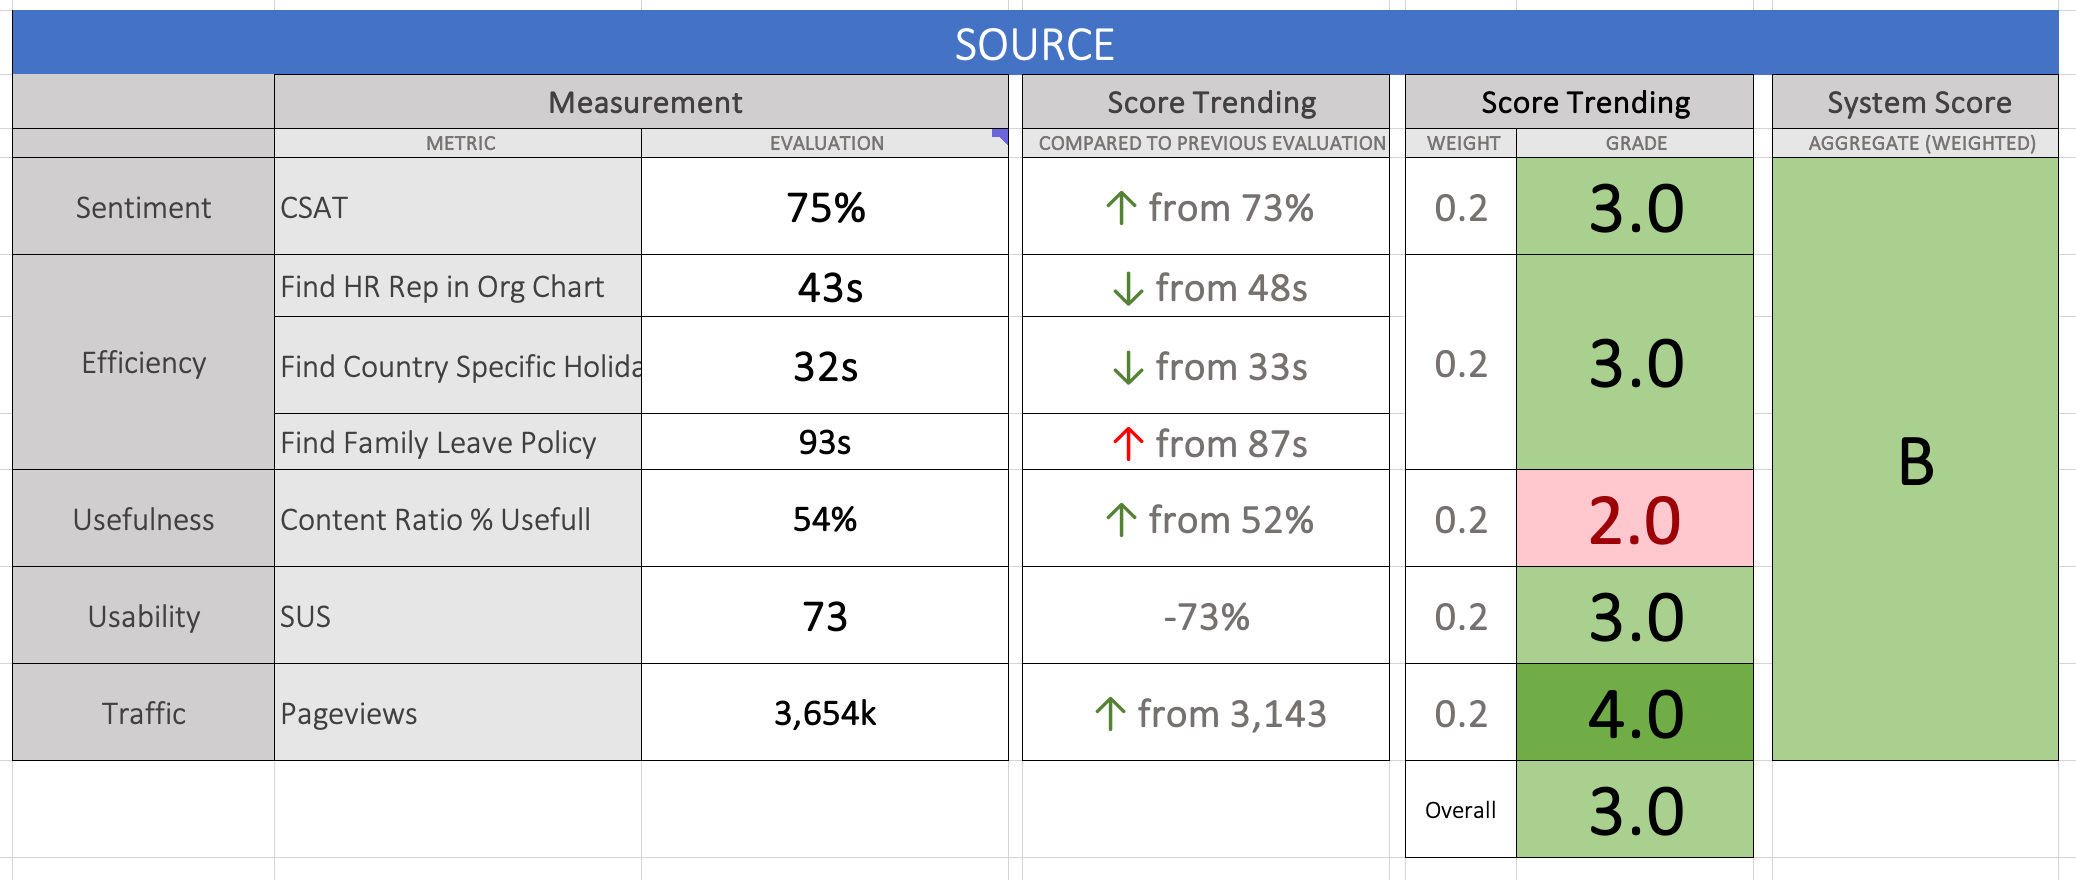
We ran the data capture for a month and created a low-fidelity dashboard.
The final phase for this iteration was distributing the lo-fi dashboard to the intended audiences and then gathering feedback on what worked well and what didn’t.
Results
While still focusing on a prioritized list of tools, in the first three months, we:
- Increased eNPS by 3%
- Delivered CSAT scores of 70%+ for mission-critical applications by empowering product teams to make meaningful changes to offerings quickly.
The effort was a massive win for us as a company. While it has yet to be rainbows and unicorns, we have gone from vague sentiments and opinions of experience to a clear understanding of what needs attention.
Our product teams are making data-driven changes quicker and now spend more time in detailed strategy debates on driving needed changes.